How Can You Measure Blog Success or Failure – Digital Marketing Madness
John Maher: Hi. I’m John Maher, and this is Digital Marketing Madness. This podcast is brought to you by McDougall Interactive. We’re a digital marketing agency in Massachusetts. Today my guest is Meghan Williams.
Meghan Williams: Hi, John!
John: Hey. How are you doing?
Meghan: Good. How are you?
John: Good. Our topic today is, “How Can You Measure The Success or Failure of a Blog?” Meghan, what metrics should you use to determine if you’re blog is succeeding or not?
Meghan: You can blog for many different reasons. When you’re blogging specifically for SEO to improve your ranking in organic search on certain keywords, you want to be tracking organic traffic that’s coming to your website specifically because of certain blog posts that you’ve written.
You’d want to look in Google Analytics to see that a blog post you wrote on a certain topic, using certain keywords, has generated a certain amount of traffic from organic search sources.
John: Right, so the idea behind this idea of blogging, is just that you’re blogging on a regular basis; you’re using, like you said, particular to keywords in those blog posts; and then the idea is that you should be coming up in the search engines in Google or whatever, for some of those keywords that you’re using in the blog posts. And so you can see whether or not it’s working, by seeing that traffic coming to your site to those blog posts.
Meghan: Right. The way you see that in Google Analytics is you look for the sessions that are generated by a specific blog post. The way I like to tell clients what the specific blog posts that are working are, is the ones that have the highest number of sessions, and the lowest bounce rate.
That means that lots of people are coming to that page. That page is showing up in a lot of search results, and people are clicking through those results to get to your website. They’re also not leaving right away.
They’re staying, they’re reading through the content, maybe they’re engaging with it a little bit, and ideally they’re clicking through to some other page on your website. We can talk about that.
John: Right, because a bounce is a one page view of your website. That would mean somebody came to your site, maybe they landed on that blog post, and then they left without viewing any other pages. That would be a bounce.
Meghan: Right. I’m sure we’ve talked about bounce rates before on this blog. In general, on the web, I think if you’re looking at a page with a bounce rate of 80 or 90 percent, that’s really high. If you have a bounce rate of, what did you say, like 60?
John: Yeah. 50, 60 percent is a little bit better.
Meghan: That’s what you should be aiming for.
John: One of the things that they say is, the best bounce rate is one that’s going down. It’s a little bit hard to say, because your bounce rate on a contact page might be fairly high. If people are searching for your contact information they might be landing on the contact page, finding out the information that they need, like your address or your phone number, and then just leaving.
Meghan: That’s true.
John: That’s OK in that case. You want people to just find the information that they want and then leave. A high bounce rate on your contact page might be OK. A higher bounce rate on a blog post or on another page on your site, or a product page, or a service page, is definitely worse.
You want people to be clicking into multiple pages, and taking some further action other than just one page.
Meghan: That’s how I rank high performing blog posts, are those that generate the most sessions of traffic from organic sources but also have a low bounce rate. You can also look at more general metrics like the average time spent on sites — that’s related to bounce rates.
The blog posts where people are spending a lot of time are the good ones. In general across your site, you want people to be spending on average a good amount of time on your site.
You might also want to check out your user paths in Google Analytics to see if they are clicking through from your blog posts, where they’re going, and if they do drop off your site, where they drop off.
Maybe your blog is performing really well and bringing in a lot of traffic, but people click through to other pages on your site and quickly drop off. You want to be able to capture that. Another obvious way you want to find out if your blog is successful is if it’s actually driving people to convert.
You’d want to have your goals set up in Google Analytics to reflect that people are converting, and you’ll be able to trace where they came from and where they converted.
John: A conversion can be a purchase if you’re selling something on the website, or if you’re trying to generate leads, it could just be a form. Somebody filling out a form, that kind of thing. Why are those metrics important?
Meghan: We talked a little bit about what specifically is important about each of those metrics, but the general idea is that blogging requires a lot of effort. If you’re doing it consistently, it takes a lot of time to come up with posts, and write them, and edit them, and get them live, and promote them.
You want to make sure you’re getting your return in investment on that time. The only way to tell if you’re doing that, is if you’re tracking your specific metrics that show you’re either meeting or you’re not meeting your goals. When we talk to clients, the primary goal is to get traffic through organic search.
That’s why you’re creating targeted blog content. You can also generate traffic because people are also sharing your blog posts on social media, or linking to it. You’d see that as referral traffic in Google Analytics.
Of course you want to be providing value to maybe your existing customers or prospects, and delighting them with interesting content that they find useful and would recommend to their friends, and keep you top of mind for them if they’re looking to buy from you.
The way to boil those goals down to see if you’re actually achieving them is to track these metrics.
John: How do you go about that? How do you find those metrics in Google Analytics, and really start to analyze then?
Meghan: Google Analytics can be intimidating, and there are lots of resources out there. What I wanted to do today is walk you through that first metric I said, finding the blog posts that generate the most sessions from organic search and have a low bounce rate. That’s in two parts. I just have found it so powerful in talking to clients about what’s working and what’s not, that I think it’s the most helpful.
John: Great. Walk us through that.
Meghan: First you want to go into Google Analytics, and in the left hand side bar choose Behavior, click Site Content, then Landing Pages. That’s going to bring you to the pages that people are landing on, from all sources.
John: This is the first page on the website that they’re hitting. That’s a landing page.
Meghan: Yes. Then you want to segment that. You go up to the top, just above the graph on that page. It’s on the left hand side, and you click the All Sessions button. You want to uncheck All Sessions, and instead find Organic Traffic and check that one. By default, you’re looking at all of the traffic that’s coming to your site. From social, from everywhere.
John: From everything. From referrals, and people directly typing in your domain name. You want to narrow that down to just the traffic coming from organic search.
Meghan: Then you know that you’re targeting the right keywords, your blogs are ranking in organic search, and they’re getting traffic from that. That’s what gets you the information, of what blog posts are generating organic traffic. You can sort it by sessions and see which ones are generating the most, and then you know you want more blog posts like these.
These are the topics that are getting people to your website, so that’s something you should blog about.
John: What’s next?
Meghan: The next piece is figuring out which ones have a lot of traffic, but a low bounce rate. The easiest way I found to do that is to export that data that you’re looking at to Excel, and manipulate it a little bit there. You first want to make sure that it’s displaying enough rows in Google Analytics.
You scroll down to the bottom and it says, “show 10 rows,” I think by default. You want to jump that up to maybe 25.
John: So that you’re not just looking at only the top 10 landing pages, but you’re looking at the top 25, or even 50, or whatever.
Meghan: When you scroll back up…it’s almost at the top. It’s just under the header you’ll see landing pages. You can click Export, and then choose Excel. Once you do that, it only pulls the data that’s displaying on that sheet. It will only pull the 10 rows, or if you expand at 25, it’ll pull those 25 rows of data.
John: It’s not just going to export all of the data.
Meghan: Yeah. That would be crazy.
John: That could be thousands of pages if you have a large site.
Meghan: Yeah. Exactly. That’s why you want to make sure you’re displaying the data you want to see. Top 25 is usually what I go for.
John: It does the top 25 in terms of the number of sessions. Is that right?
Meghan: Yes. I think it’s sorted by sessions by default. It will be the top 25 pages or posts, whatever you’re looking at, that generate the most sessions.
John: Basically the ones that get the most traffic.
Meghan: We’ve already segmented to organic, so we know we’re only focused on the ones that are…
John: Getting organic traffic.
Meghan: Because of the SEO writing you’re doing.
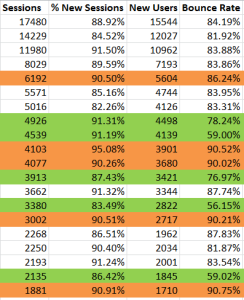
Once you’re in Excel, you just highlight the section of the spreadsheet with all the data in it that you want to sort. You go across the top tab and click Data, and then choose Sort. It gives you this really cool function, where you can sort the data by multiple factors.
First you have it sort by Sessions, and from Largest to Smallest, and then you add a level. Click the Add Level button and it adds another row, where you can sort the data. Sort by bounce rate, and then choose Values, and then choose Smallest to Largest.
It goes through the data and sorts…the ones with the highest number of sessions are first, but they also have to have a low bounce rate attached to it. So you get — the top of your data is this really valuable piece of information.
John: Combinations of highest number of sessions, with a low bounce rate are at the top.
Meghan: Yeah. That alone has been really helpful with some clients. Just illustrating it’s not just a web page that generates the most traffic, it’s not just web pages that get the most shares on Facebook. You want a combination of these metrics, to see what’s working and what’s not.
All of this is really just a tip of the iceberg with what you can do, and what you can analyze. We’ve talked about a lot of different metrics in here, and there’s lots of, as I said, resources that help you pass through Google Analytics. It’s a complicated, powerful tool.
That’s the role we serve for our clients, too. It’s to really show them how to dig into, and find, specific metrics that show what’s working and what’s not.
John: All right. That’s really great advice. Meghan, thanks very much for walking us through that.
Meghan: No problem. Thanks for having me.
John: For more information about digital marketing, visit mcdougallinteractive.com. Make sure you subscribe to this podcast on iTunes. Thanks for listening. I’m John Maher. See you next time on Digital Marketing Madness.
Leave a Comment!